
Bonita Springs, FL Housing Market Update: April 2025
The Bonita Springs real estate market has shifted noticeably in 2025. Here's a straightforward look at what the numbers actually show and what it means if you're thinking about buying or selling.
Median Sold Price: $530,000
The median sold price is the middle price point of all sales. Over the past year, Bonita Springs hasn't seen any meaningful appreciation. Prices have been flat, with a slight dip from $530,000 to $525,000. Flat pricing like this usually signals that the market is losing momentum, and sellers are starting to feel more pressure to negotiate.
Median List Price: $599,000
The median list price shows what sellers are hoping to get. Right now, list prices are running higher than what buyers are actually paying. The gap between list and sold prices, combined with softening list prices over the past year, suggests sellers are adjusting expectations downward.
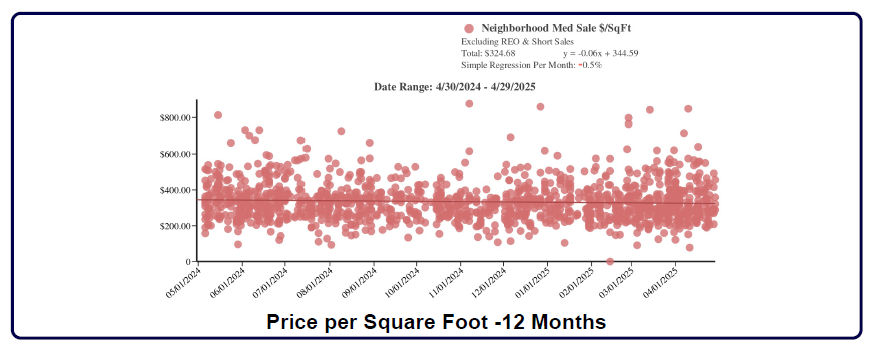
Median Price per Square Foot: $310.56 (Recent 3 Months)
Looking at prices on a per-square-foot basis makes it easier to compare different properties. Over the past year, the median price per square foot dropped from about $324.68 to $310.56. When values start slipping here, it's often one of the first warning signs that a market is weakening, even if headline prices still look stable.
Median Days on Market (DOM): 52 Days
Days on Market tracks how long it takes to sell a property. At 52 days, homes are still moving reasonably well, but it's not fast enough to hold prices steady without some downward pull. In markets that are beginning to decline, DOM typically holds steady at first, then starts to stretch longer as buyers get pickier.
Inventory and Absorption Rates
There were about 1,359 closed sales over the past year, but about 1,473 active listings are currently on the market. That means inventory is growing. At today's pace, it would take about 12 to 13 months to sell off the current listings, which is longer than what you want to see in a balanced market. More inventory usually leads to more price cuts.
Year Built Trends
The average year built among closed sales is around 2000. Many of these homes are now 20 to 30 years old, which means buyers have to factor in the costs of updates, higher insurance premiums, and the potential for future repairs. These things also start to weigh on property values when markets soften.
Property Types
The data covers all types of residential properties, including single-family homes, villas, condos, and townhouses. Bonita Springs continues to be a mixed market. The inland areas are dominated by suburban subdivisions, while coastal areas lean heavily toward condos and higher-end gated communities.
Visualizing the Trends
The following graphs help paint a clearer picture:
Median Sale Price Trends (12, 6, 3 Months): Shows that prices have flattened out and dipped slightly.

Median Price per Square Foot Trends (12, 6, 3 Months): Highlights a steady decline in per-square-foot values.
Active List Price Trends: Reflects how sellers are quietly lowering asking prices to match shifting buyer demand.

Absorption Rate and Housing Supply Trends: Confirms that inventory is building faster than sales, tipping the balance toward buyers.

Every graph points towards market softening. It's not a crash, but it's clear the market is no longer moving in sellers' favor.
Bottom Line: The Bonita Springs market as a whole is showing the stages of decline. Price slippage, longer inventory times, and tougher negotiations are all in play. Sellers who are serious about moving their property will need to be realistic about pricing. Buyers should watch carefully because they may have more leverage in the months ahead.
If you're considering making a move in 2025, understanding these shifts now will put you in a much better position to navigate the changing market.